Print
PDF
Proportion of the inhabitants connected to the public sewerage system in 2020
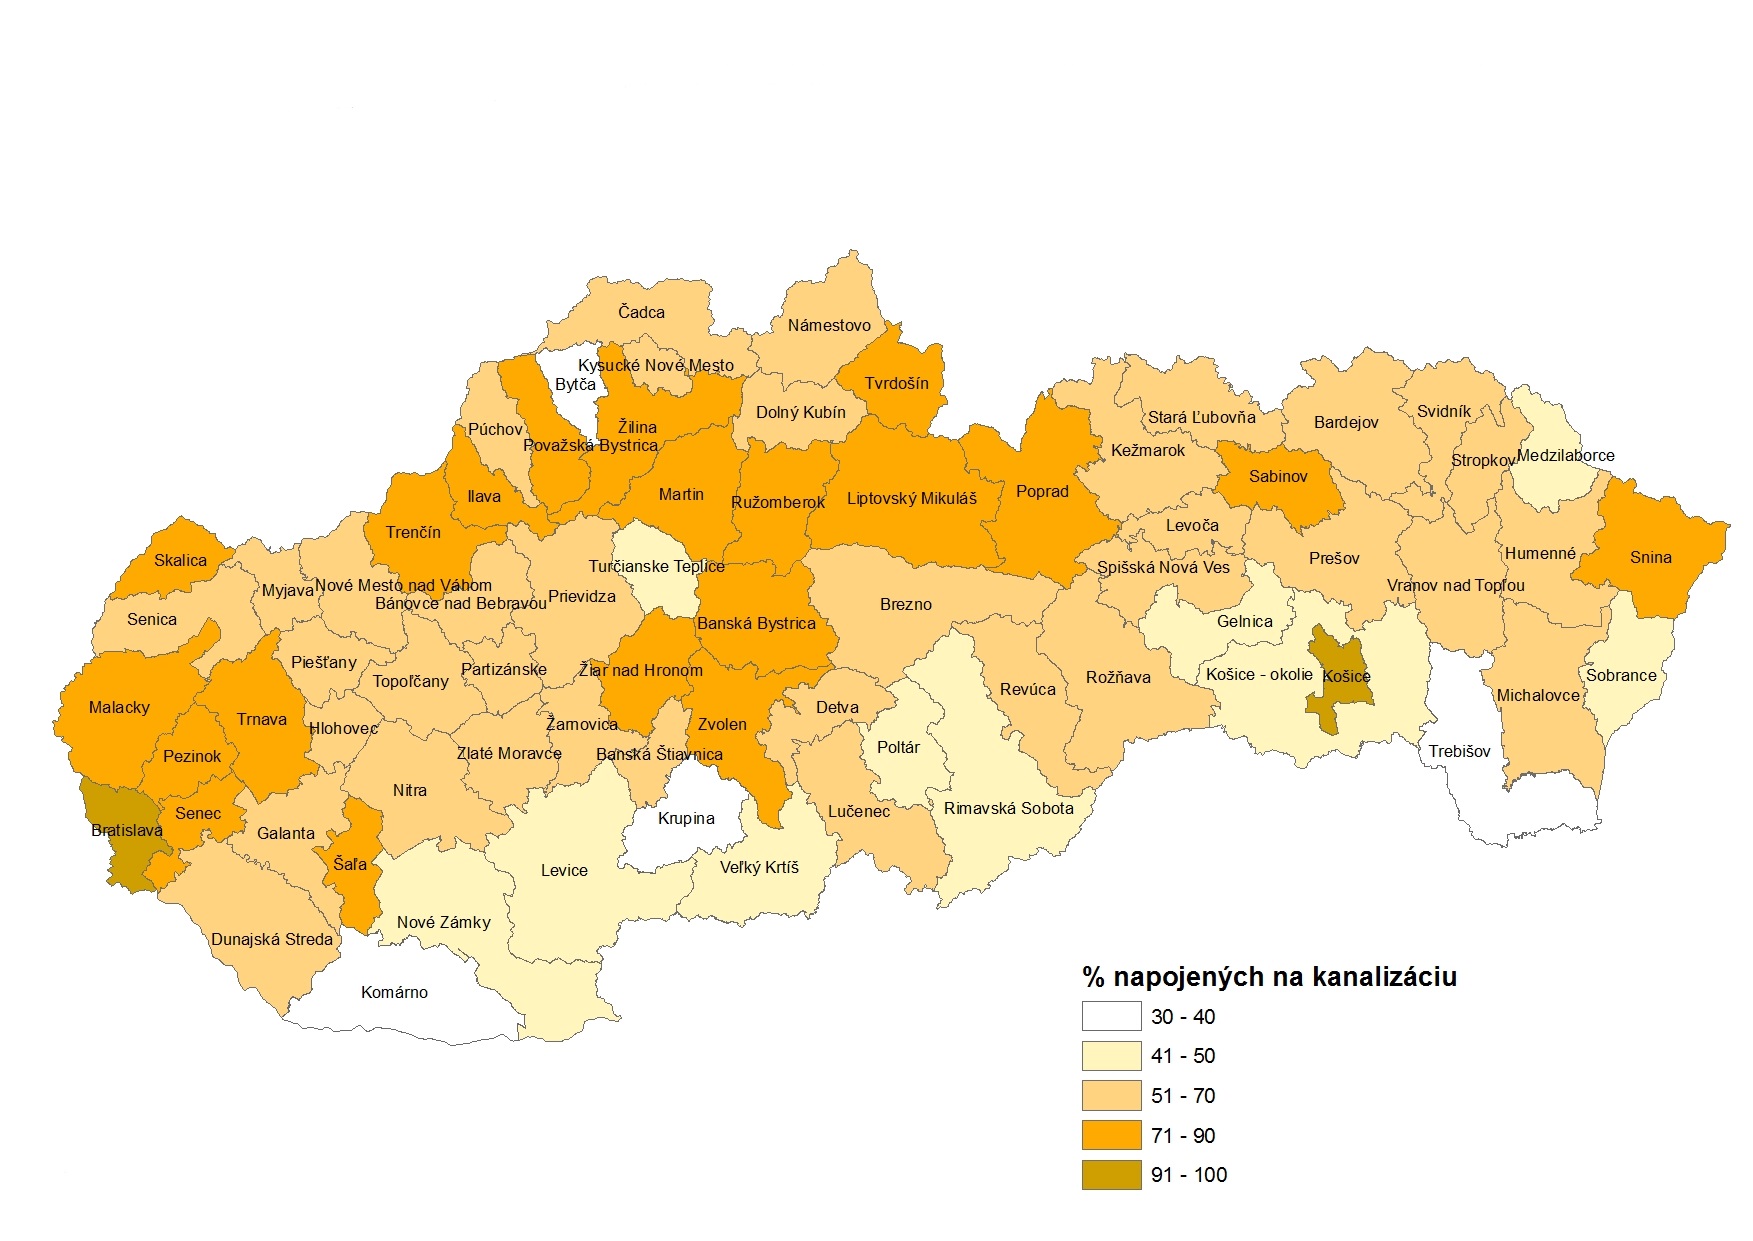
Source: WRI
Connecting the public to the public sewerage system
Last update of indicator16.12.2021
Indicator definition
This indicator describes the percentage of the population connected to public sewerage systems.
Key messages
Tempo in the growth of towns, industrialisation of territories, and development of services significantly exceeded the speed in the growth of water management infrastructure (sewerage networks and WWTPs). Existence of water management infrastructure is at the same time a precondition for further social and economic development at the local, regional, national, and global levels.
Over the last years, Slovakia showed a slight progress in discharging and treatment of municipal wastewater. Number of inhabitants connected to the public sewerage system in 2020 reached the number of 3 769 thous., which represents 69.69 % of total inhabitant count. Compared to 2000, this represents a growth by 12.9 %, growing only by 0.56 % compared to the previous year. In 2020, of total number of 2 890 municipalities, only 1 152 had a built public sewerage system (i.e. 39.86 % of total number of municipalities in Slovakia). Especially the regions of Trenčín, Nitra, Banská Bystrica, and Košice do not keep up with the national average. Despite the reached growth in connecting the public to public sewerage systems, level of connectedness of the public still does not keep up with the development of public water supplies. With regard to the goals and requirements outlined by the Council Directive 91/271/EEC concerning urban waste water treatment, Slovakia focused its maximum attention and funds to building public sewerage systems and increasing the efficiency of waste water treatment plants. (WWTP) Effects of this process manifest themselves through progressive increase in the number of inhabitants living in households connected to public sewerage systems, but also mainly through improved parameters of discharged treated waste water, and by decreasing the volumes of contaminants into the aquatic environment respectively.
Over the last years, Slovakia showed a slight progress in discharging and treatment of municipal wastewater. Number of inhabitants connected to the public sewerage system in 2020 reached the number of 3 769 thous., which represents 69.69 % of total inhabitant count. Compared to 2000, this represents a growth by 12.9 %, growing only by 0.56 % compared to the previous year. In 2020, of total number of 2 890 municipalities, only 1 152 had a built public sewerage system (i.e. 39.86 % of total number of municipalities in Slovakia). Especially the regions of Trenčín, Nitra, Banská Bystrica, and Košice do not keep up with the national average. Despite the reached growth in connecting the public to public sewerage systems, level of connectedness of the public still does not keep up with the development of public water supplies. With regard to the goals and requirements outlined by the Council Directive 91/271/EEC concerning urban waste water treatment, Slovakia focused its maximum attention and funds to building public sewerage systems and increasing the efficiency of waste water treatment plants. (WWTP) Effects of this process manifest themselves through progressive increase in the number of inhabitants living in households connected to public sewerage systems, but also mainly through improved parameters of discharged treated waste water, and by decreasing the volumes of contaminants into the aquatic environment respectively.
Summary assessment
Proportion of the inhabitants connected to the public sewerage system in 2020
Source: WRI
International comparison
The OECD Green Growth database contains selected indicators for monitoring progress towards green growth to support policy making and inform the public at large. The database provides a synthesis of data and indicators available across a wide range of domains. The sources of the underlying data used to populate the Green Growth Indicators, as presented here, include a range of OECD databases and, in some cases, external data sources. The database covers OECD member countries, accession countries and selected non-OECD countries (including the BRIICS economies - Brazil, Russian Federation, India, Indonesia, China and South Africa).