Atmospheric precipitation
Last update of indicator24.01.2024
Indicator definition
The indicator describes the observable development of atmospheric precipitation totals as one of the negative manifestations of climate change on the territory of the Slovak Republic.
Key question
What is the observable development of atmospheric precipitation?Key messages
- The year 2022 was below normal in terms of precipitation as a whole, 13 daily precipitation totals of 70 mm or more were registered in Slovakia in 2022, i.e. more than three times less than in the previous year
| Change since 2005 | Change since 2015 | Last year-on-year change |
|---|---|---|
| - |  |
|
| More and more significant negative effectsof climate change were recorded. | The negative effects of climate change continued, the deficit of electricity was extraordinary to extreme |
Summary assessment
Annual total atmospheric precipitation in Slovakia (2022)
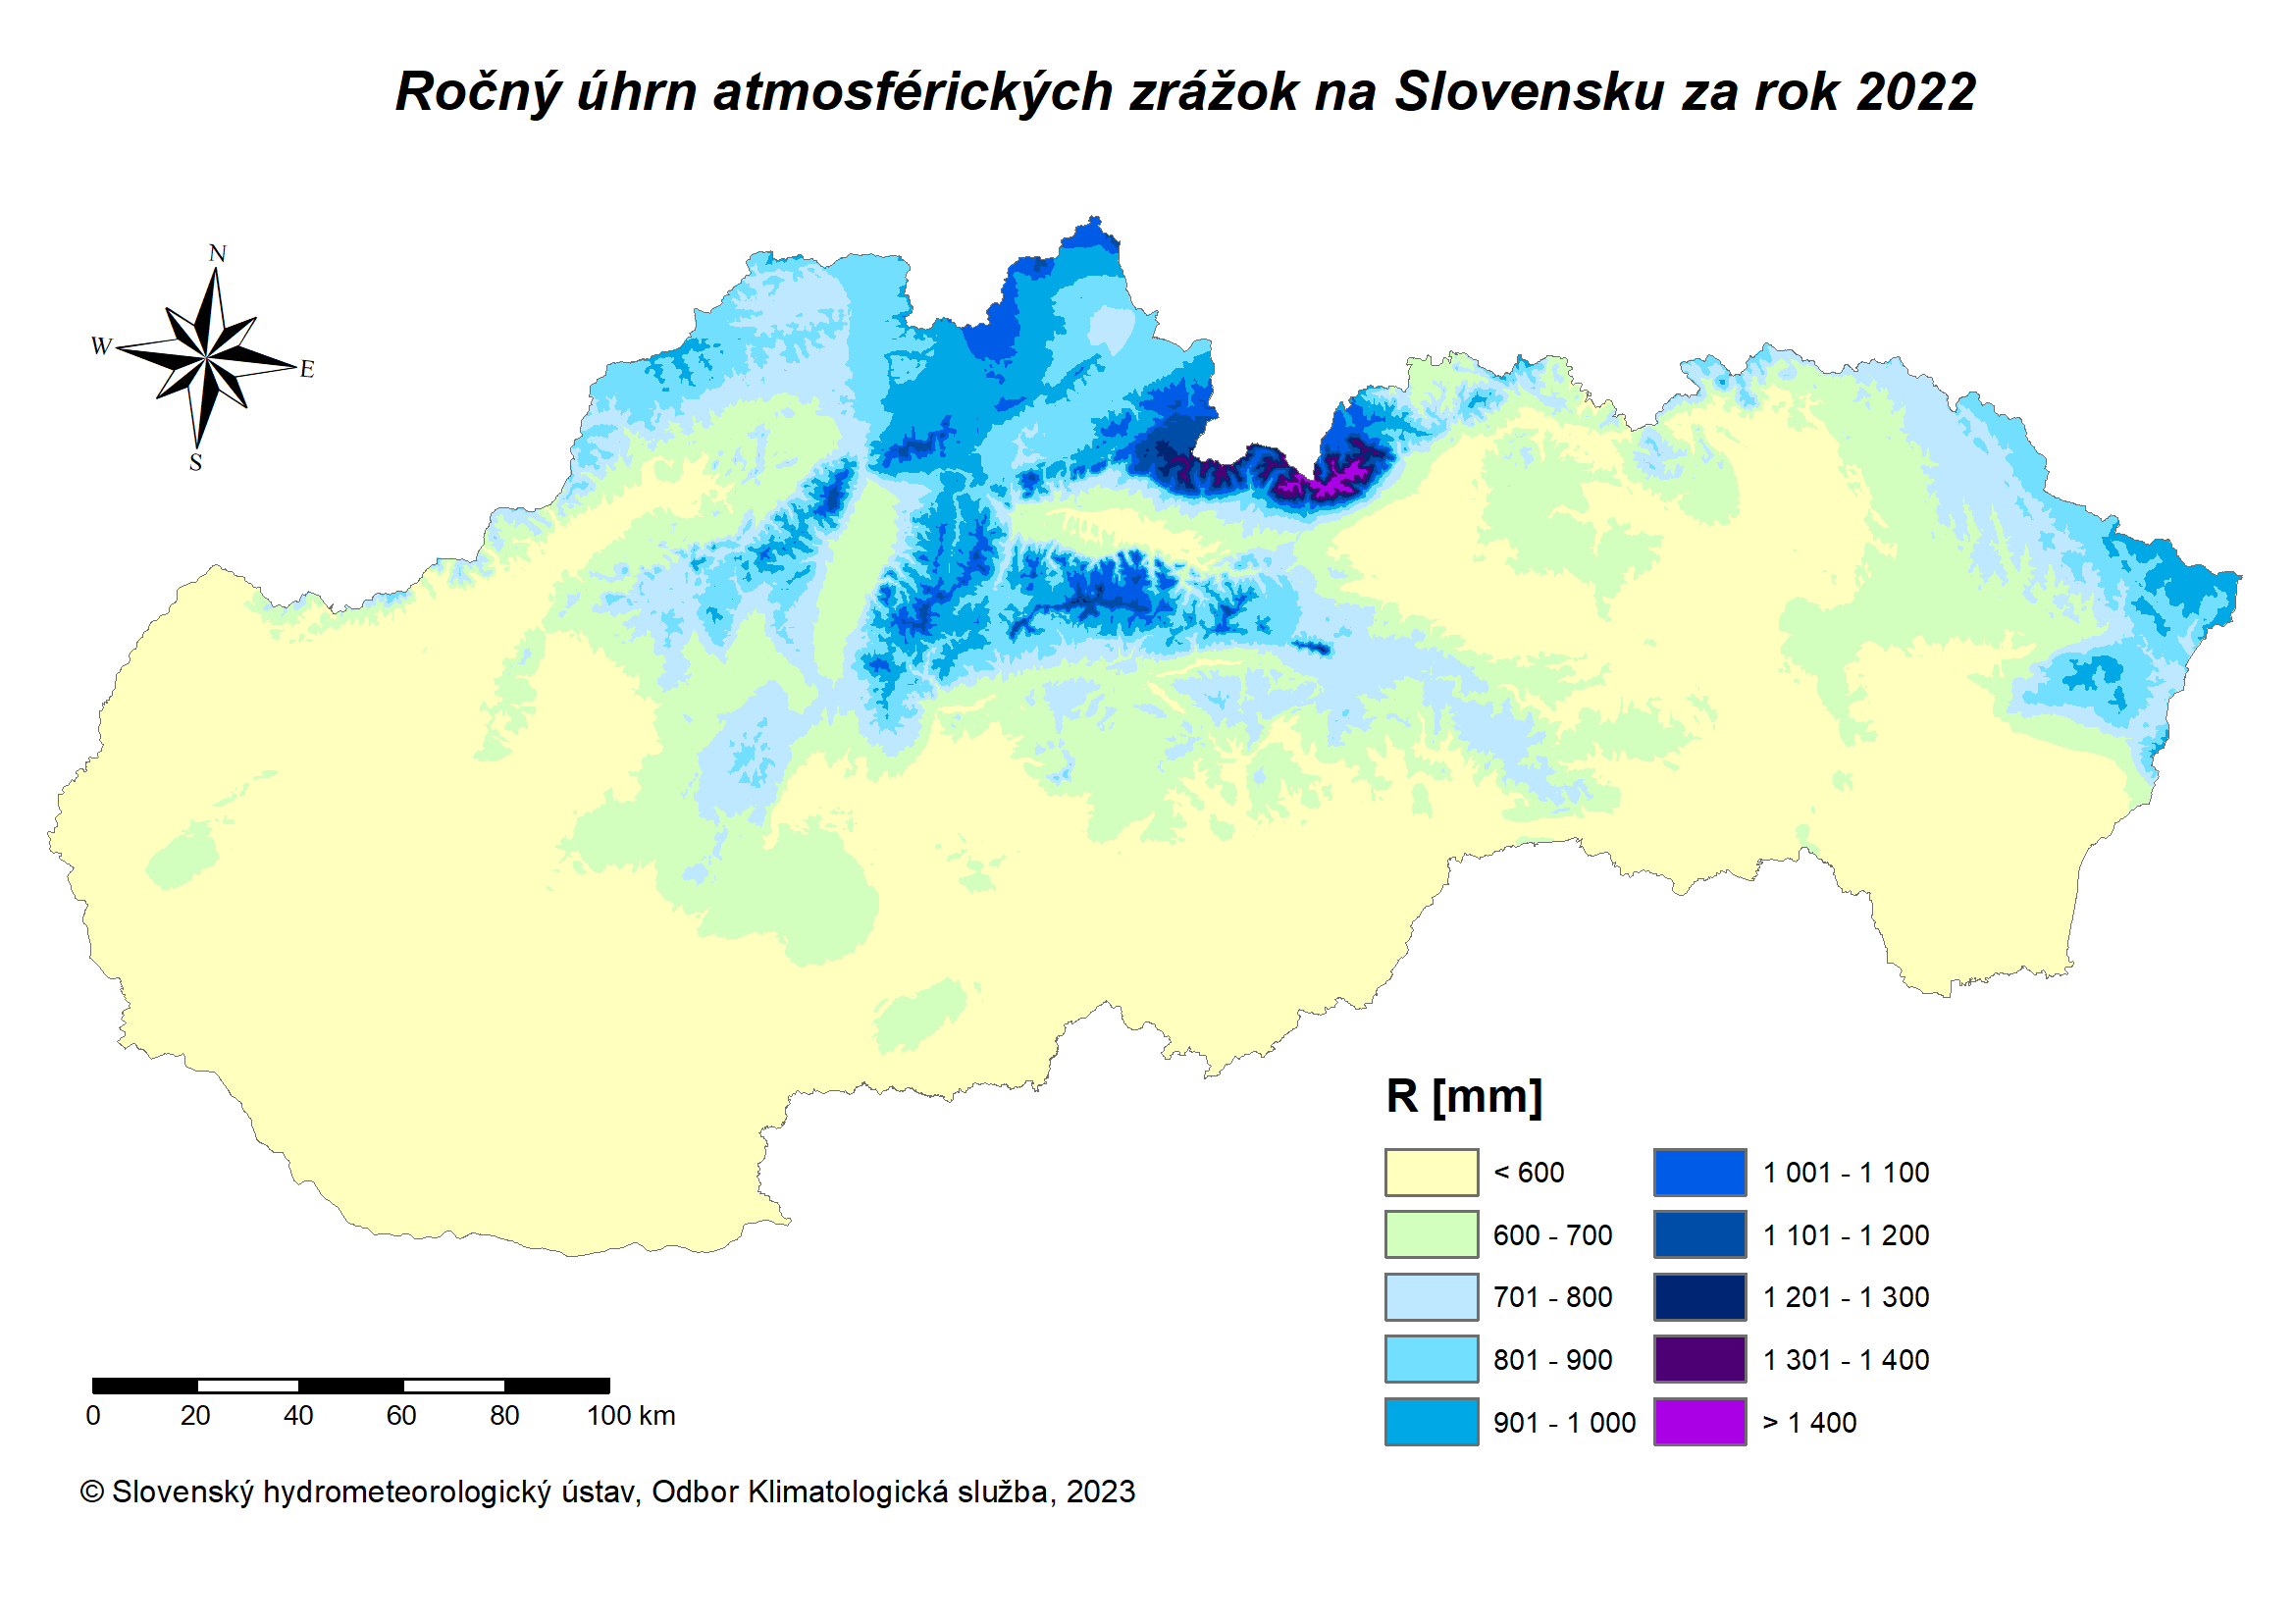
Zdroj: SHMÚ
Percent of normal (1991–2020) annual precipitation totals for 2022
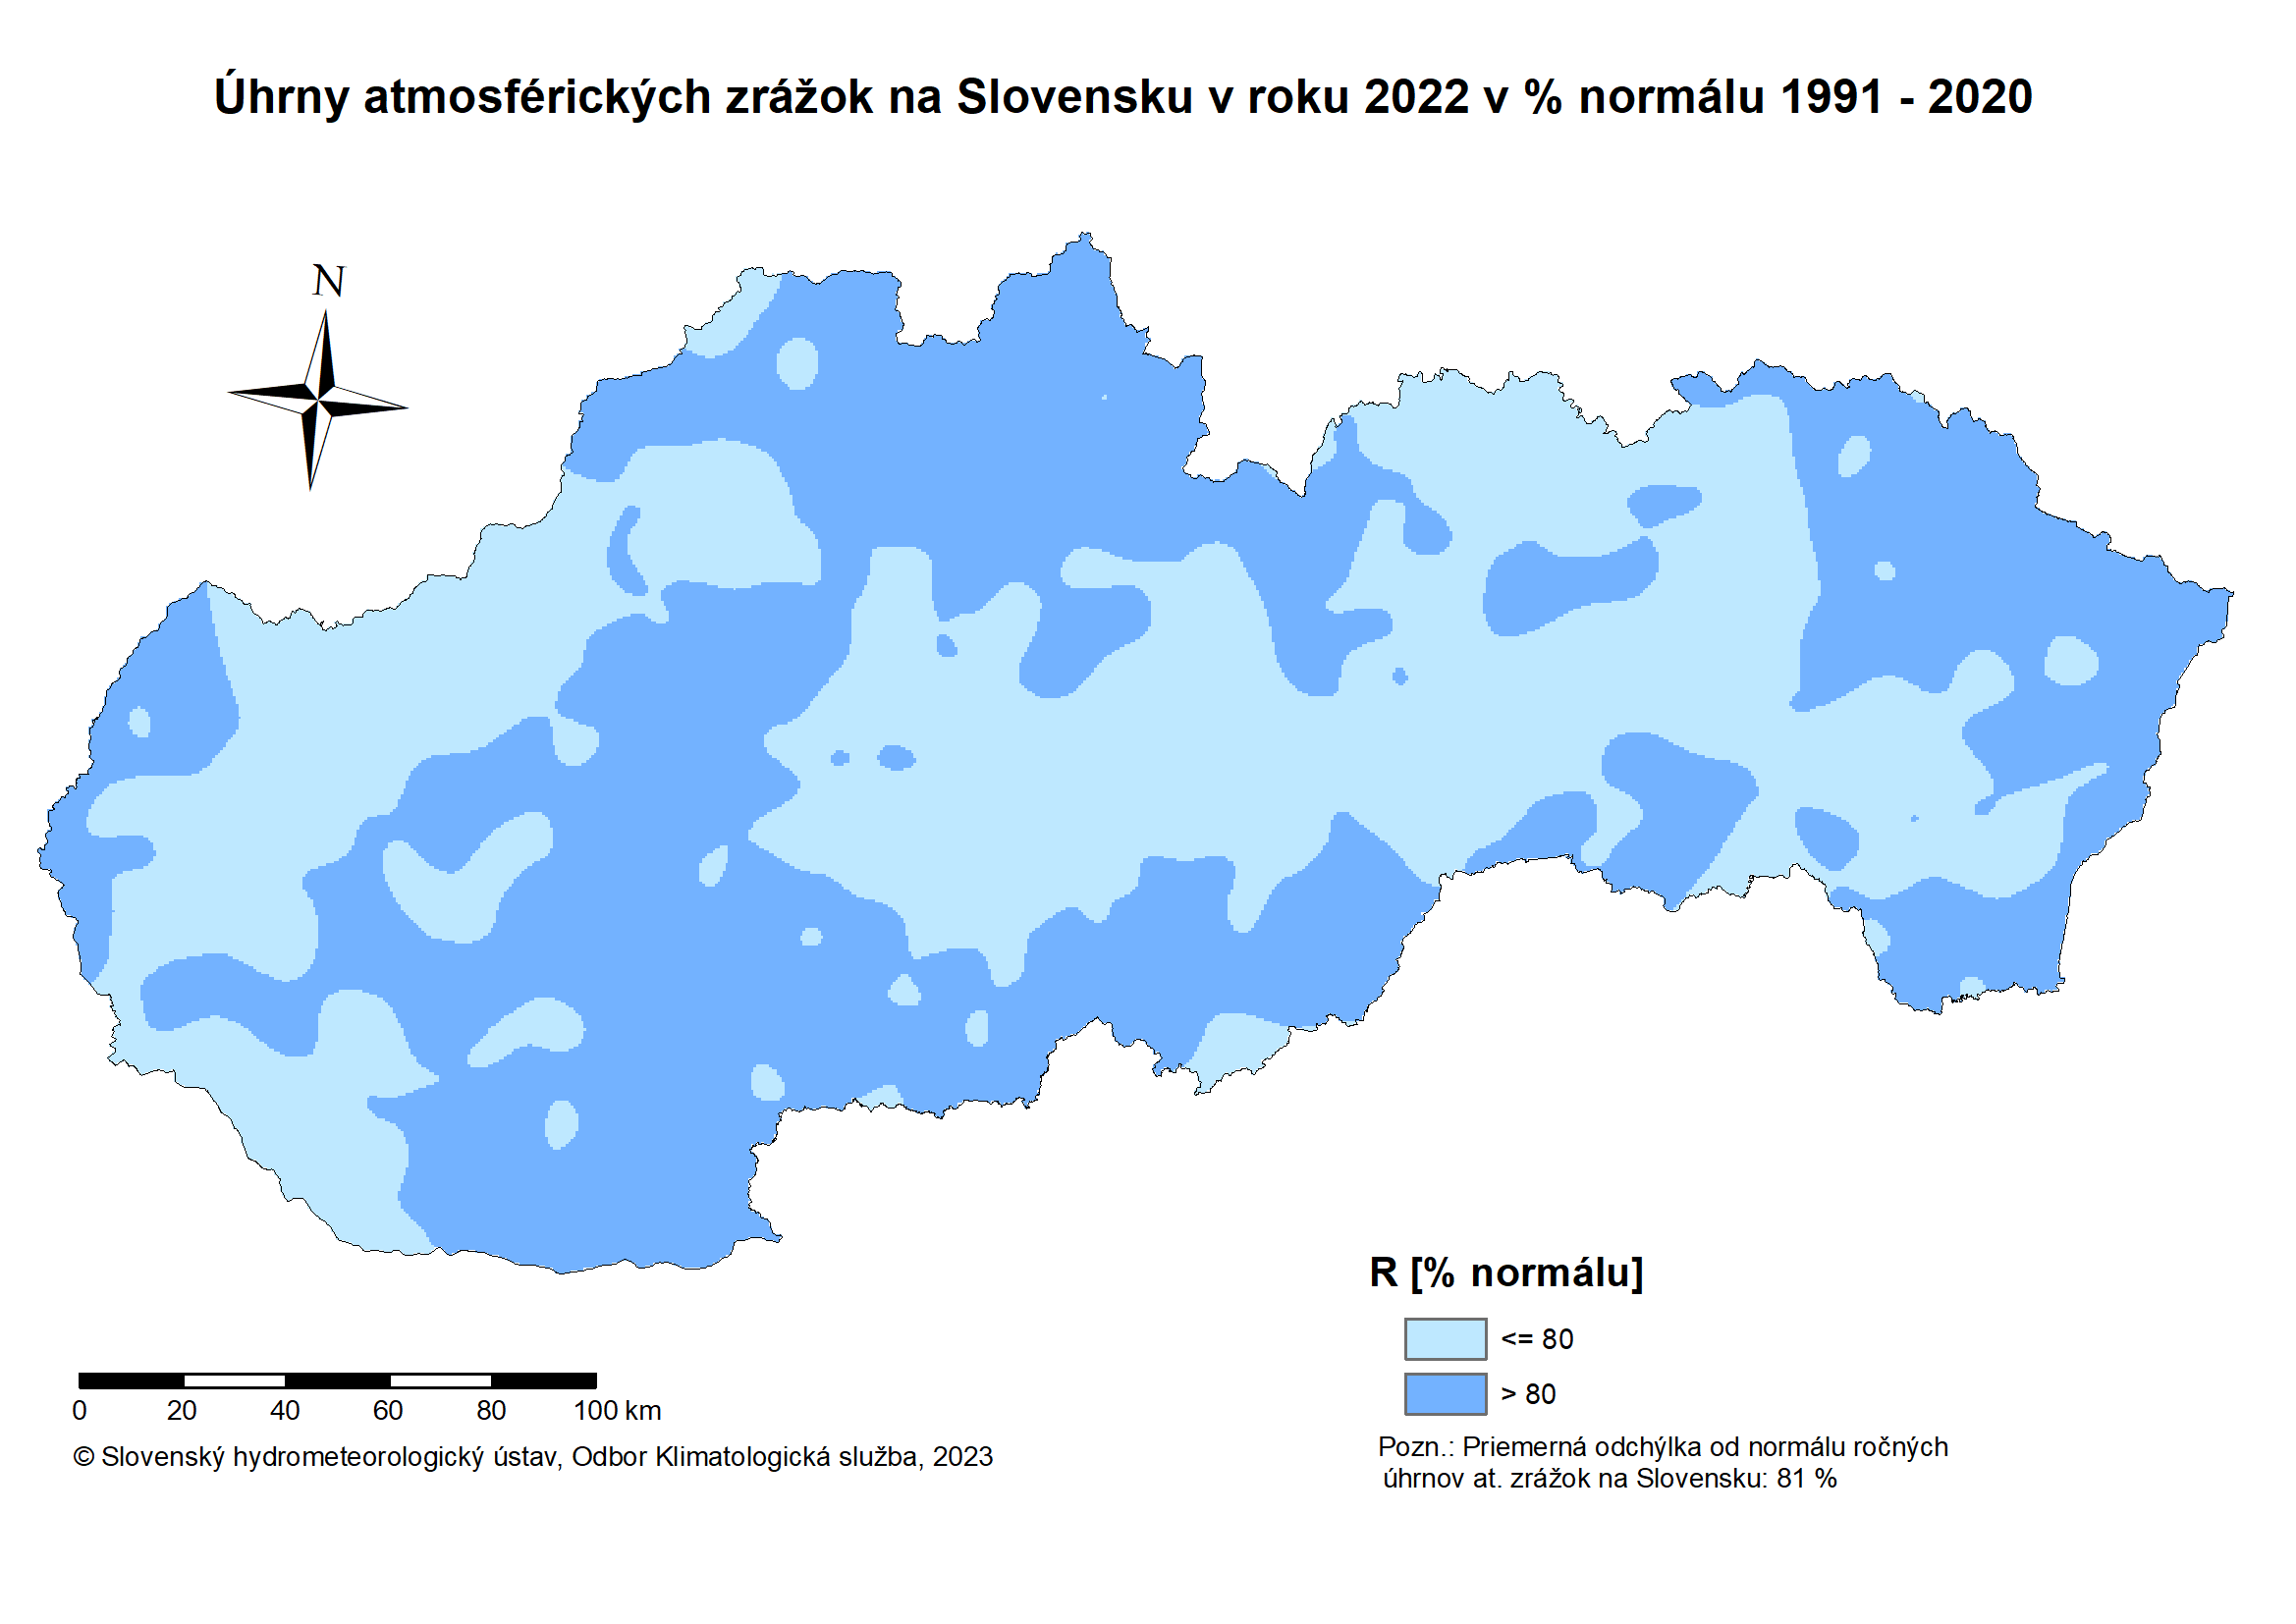
Source: SHMI
Detailed assessment
Annual total atmospheric precipitation (1951 – 2022)
The year 2022 was below normal in terms of precipitation. The annual value of the spatial total of atmospheric precipitation for the entire territory of Slovakia, calculated by the isohyet method, reached 619 mm (deficit of 143 mm, 81% compared to the long-term average 1901–2000). In western Slovakia, the annual value of the spatial total of precipitation reached 508 mm (a deficit of 154 mm, 77% compared to the long-term average of 1901-2000). In central Slovakia it was 724 mm (deficit 148 mm, 83% compared to the long-term average 1901–2000) and in eastern Slovakia it was 607 mm (deficit 140 mm, 81% compared to the long-term average 1901–2000). The relatively highest annual precipitation totals were recorded in some parts of the Tatras, Low Tatras and northwestern Slovakia, for example Lomnický štít 1877 mm, Skalnaté Pleso 1314 mm, Zuberec-Zverovka 1231 mm, Oravská Lesná 1149 mm, Martinské hole 1148 mm, Jasná pod Chopkom 1105 mm, Chopok 1085 mm, Ždiar – Podspády 1079 mm, Vitanová – Oravice 1063 mm, Vrátna dolina 1055 mm, Novoť 1029 mm, Tatranská Javorina 1023 mm and Stará Bystrica 1009 mm. On the contrary, the lowest annual rainfall totals were registered in some places of the Danube Plain, or in adjacent areas, for example, less than 400 mm was 376 mm in Cífer, 379 mm in Jánošíkov na Ostrov and 395 mm in Boleráz.
The balance of atmospheric precipitation in individual months of 2022 was negative in Slovakia in January, March, April, May, June, July, August, October and November. On the contrary, more abundant precipitation was recorded in September, but also in December. Especially at the end of spring and during the summer, strong storms gradually started to occur in some cases and their occurrence was quite often local in this season. The precipitation deficit was already carried over from the fall and the beginning of winter in 2021 and continued continuously until the end of summer in 2022, while its overall extent and significance took on an extraordinary to extreme character in larger areas of Slovakia. The resulting precipitation deficit was partially corrected locally by summer stormy downpours. Above all, there was a lot of rain in the second and third decade of September, which corrected the very unfavorable drought indicators and revitalized the natural landscape. In October and also in November, there was less precipitation again, but this did not affect most of the drought characteristics as adversely as it was in the previous seasons.
The winter of 2021/2022 was, if we evaluate Slovakia as a whole, below average in terms of precipitation. This winter was also above average warm, although during its course, there were transitional frosty periods and at this time more significant temperature fluctuations and certain regional differences in temperature conditions and in the occurrence of snow cover were registered. For example, on 27 December 2021, the minimum daily air temperature in Podolínec dropped to minus 27.3 °C, but in the extreme south-west of Slovakia it was already relatively warm at that time, and on the very first day of 2022, the maximum daily air temperature in Bratislava was recorded at the airport of 16 .0 °C. This had an impact on the stability of the snow cover at lower altitudes. Its lack at the beginning of spring 2022 contributed, in addition to other causes, to the development of an extraordinary to extreme drought, which lasted a long time in Slovakia in 2022 and affected a large area.
In the summer of 2022, as it happens more regularly at this time of the year, stormy downpours again contributed a large proportion to the total amount of precipitation at this time of the year. The highest daily precipitation totals recorded during these storms this summer include: 21/08/2022 in Lipovce 115 mm, 21/08/2022 in Trstená 107 mm and 21/08/2022 in Ústí nad Priehradou 106 mm.
In 2022, 3 daily rainfall totals of 100 mm or more were recorded in the SHMÚ network of rain gauge stations. They occurred on August 21, 2022. In 2022, 13 daily precipitation totals of 70 mm or more were registered in Slovakia, which is more than three times less than in the previous year. In 2022, 57 daily precipitation totals with a value of 50 mm or more were registered in the SHMÚ network of precipitation measuring stations, and it was even more than four times less than in the previous year. It was also a symptom of the lack of atmospheric precipitation and drought this year.
The annual amount of atmospheric precipitation in Hurbanov in 2022 was 469.2 mm.
Since 1951, the annual amount of atmospheric precipitation in Hurbanov represents a statistically insignificant upward trend (increase of 19 mm) in a linear trend until 2022, while the years 1965-1966, 2010 (maximum), 2013-2014 and 2016 were statistically significantly rich in precipitation totals , on the contrary, the years 1967, 1971, 1978, 1982 – 1983, 1990, 2003 and 2011 (minimum) were the poorest in terms of annual totals. We observed the highest negative difference (deficit) in the annual precipitation total compared to the normal value for the period 1991-2020 in 2011 (- 246.7 mm), on the contrary, the highest positive difference in 2010 (406.5 mm).
The annual amount of atmospheric precipitation in Liptovský Hrádok in 2022 was 573.4 mm. Since 1951, the annual amount of atmospheric precipitation in Liptovský Hrádok represents a statistically significant upward trend in a linear trend until 2022 (an increase of 110 mm), while the years 1970, 1974, 2004, 2010 (maximum), 2014, 2016 – 2017 and 2020 were statistically significantly rich in precipitation totals, on the contrary, the years 1956 (minimum), 1968 – 1969, 1971, 1973, 1982 – 1983 and 2003 were the poorest in annual totals. We observed the highest negative difference (deficit) in the annual precipitation total compared to the normal value for the period 1991-2020 in 1956 (-263.2 mm), on the contrary, the highest positive difference in 2010 (250.7 mm).
Development of annual precipitation totals (1951 – 2022)

